For commercial General Contractors (GCs), getting three bids back per trade is the gold standard in bidding. Owners expect this and GCs are pressured to deliver. However, as construction demand rises and subs become increasingly busy, the once-attainable goal of "three bids back" is starting to feel like an empty platitude—a promise made to assure owners but rarely achievable in practice.
In this blog post, we analyze a simple, but important question: Is 3 bids back per trade still possible? Or is this a relic of the past?
Key Takeaways
- Three bids per trade is tough—rising demand and busy subs shrink coverage to below standard.
- Texas data shows high demand in Harris, Dallas, and Tarrant; supply clusters near growing counties like Rockwall.
- Subs prefer jobs within 55 miles, decline 27% for resources, 26% for scope mismatch—optimized ITBs boost 30%+ responses.
- Best coverage in Rockwall, Ellis; worst in Harris, Bexar—target growth areas strategically.
- Try Downtobid’s AI demo now to nail scopes and subs, turning data into wins.
✔️ 🤔 Is 3 bids back possible?
To explore this question, we compiled public and private data, including population data, market spend data, 60,000 historical subcontractor bids, and a national subcontractor database. Using Downtobid’s AI, we analyzed these datasets to uncover insights and determine if the goal of three bids per trade is still achievable in today's market. This is the first dataset specifically built to address this question
For this analysis, we focus on the state of Texas. Specifically, we answer these questions.
- Which counties in TX have the highest construction demand? Why?
- Which counties in TX have the highest supply of subcontractors? Why?
- What factors influence a sub’s willingness to bid (e.g. distance to job, job-fit)?
- Based on these insights, what counties are the hardest for GC to get coverage?
- Is it mathematically possible to get 3 bids back always? Why or why not?
In a time where coverage feels unpredictable, we believe our dataset and insights can help GCs be more strategic about bidding.
✔️ 🏗️ Understanding bid coverage
Our approach for understanding coverage is based on supply and demand.
- Projects (Demand): We identify which areas have the most commercial construction projects and quantify the number of projects in each county. This helps us estimate the overall demand for construction projects.
- Subcontractors (Supply): We determine which areas have the highest concentration of commercial subcontractors and explore how this varies by trade. Using historical data, we also analyze the factors that influence a subcontractor’s willingness to bid (e.g. distance to jobsite, reasons for declining bids). Once we understand supply and demand, we can predict bid coverage.
- Low coverage = High demand, low supply : Areas with high demand and low supply are those with many active projects but few subcontractors. For GCs, these areas will be challenging because the scarcity of subs makes it difficult to get the necessary bid coverage. For subcontractors, these areas are advantageous because there is less competition.
- High coverage = Low demand, high supply : Conversely, areas with low demand and high supply have few active projects but many subcontractors. For GCs, these areas are ideal because the abundance of subs makes it easier to get bid coverage. For subcontractors, however, these areas are less desirable due to the high level of competition, making it harder to win bids.
✔️ 📈 Demand
Which counties in Texas have the most demand for construction projects? Why? To analyze this, we combined 3 datasets
- TX population data
- 20,000 live TX bids from BasisBoard (digital bid board for subs)
- Publicly available TX bids scraped from the internet
Surprisingly, our findings suggest that while population size correlates with bid demand, alternative growth indicators, such as population growth rates, can often signal disproportionate bid demand.
✔️Takeaways
1️⃣ County population is not indicative of construction activity
While larger populations generally mean higher construction demand, the most populous counties don't always have the most bids.
2️⃣ Invest in areas where population growth rate is high
Counties like Chambers, Comal, Ellis, and Rockwall saw the highest population growth in 2022-2023 (¹). These counties rank high in bids received but lower in total population, indicating a disproportionate amount of construction activity relative to their population.
3️⃣ Bid demand is concentrated in top 5 counties
The top 5 most populous counties receive over 57.8% of bids. In Texas, this is Harris, Dallas, Tarrant, Bexar, Travis. Afterwards, there is a heavy dropoff and the rest of bids fall to the 249 counties.
✔️Visualizations
Counties with largest populations don’t always receive most bids
![]() Ranking counties by population and total projects bidding
Ranking counties by population and total projects bidding
Texas construction is concentrated in 3 major areas
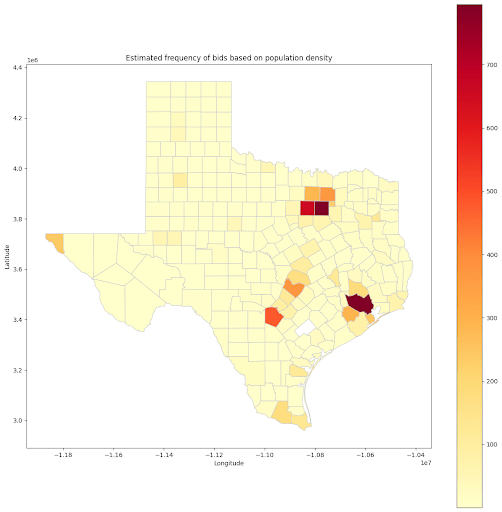 Counties with most construction based on population and historical bid data
Construction bids heavily concentrated in 5 counties
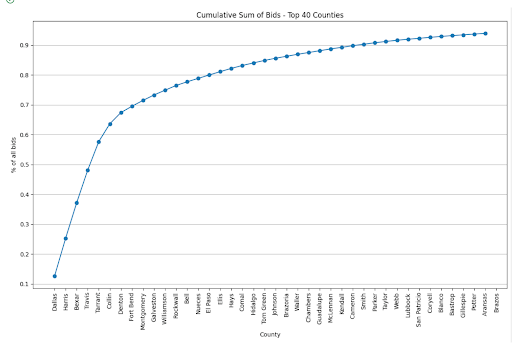 Cumulative sum of construction bids by county
✔️ 📈 Supply
Which counties in Texas have the most subcontractors? What factors influence these subcontractors to bid on projects? What do these insights tell us about bid coverage in these counties?
To analyze this, we combined 2 data sources
- Downtobid’s national subcontractor database²
- 60,000 sub bids from BasisBoard
Based on the data, subs often bid close to their offices (80% jobs occur within 55 miles). Subs are often so busy that they will decline most jobs, but their decline reasons center around 4 major themes.³
✔️Takeaways
1️⃣ Subs geography reflects bid demand
Subs are geographically concentrated around counties with the most bids, but many subs strategically position themselves between multiple counties to maximize the projects they can reach within 100 miles.
2️⃣ Subs decline jobs for 4 big reasons
There are 4 major reasons for why subs decline bids, with no reason dominating.
- 27% - Limited resources : not enough manpower or estimating resources
- 26% - Not in scope : don’t do this type of work or union/non-union reasons
- 21% - Other : unreported reason
- 13% - Trust : don’t do work for this GC
- 13% - Too far : the job is too far
3️⃣ Nearly every sub likes to bid within 100 miles
Across all projects, over 87.1% total bids that were accepted and bid on by subs occur within 100 miles away from the office. We see a steady dropoff as distance from jobsite to office increases. 80% of jobs : 0 and 55 miles away 15% of jobs : 55 and 180 miles away 5% of jobs : 180 - 400 miles away anomalies : 400+ miles away
✔️Visualizations
Sub office locations reflect bid demand
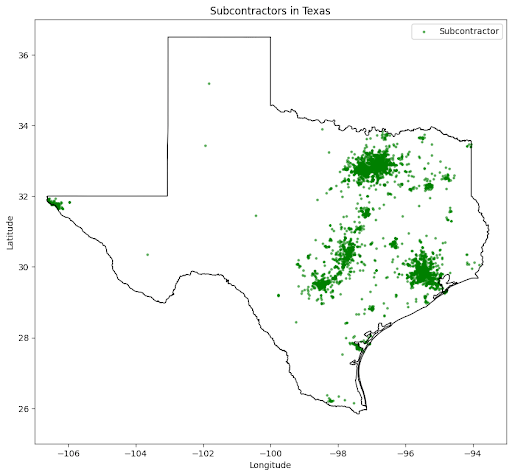 Locations of TX subcontractors in DTB's subcontractor network
Reasons why subs decline bids
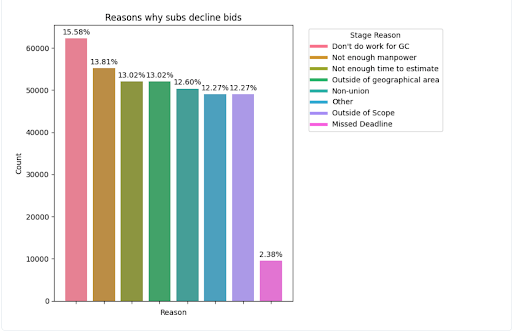 Distribution of decline reasons based on 60,000 live bids
By total projects, most jobs occur less than 100 miles away from office
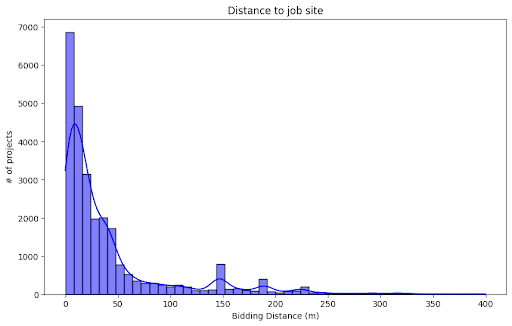 Average distance from office to jobsite across all projects⁴
By average bidding distance, most jobs occur less than 55 miles away from office
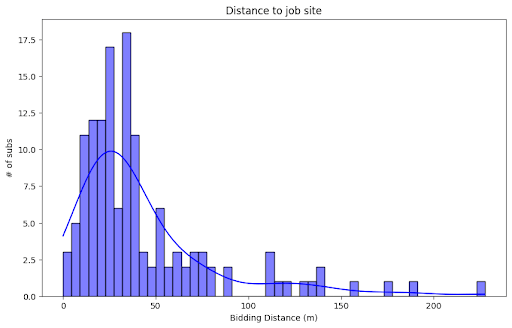 Average distance from office to jobsite based on equal weighting of subs
✔️📈 Understanding coverage
The last sections answered two questions.
- Demand: Where are most construction jobs being bid out?
- Supply: Where are most subcontractors located and what influences their bidding?
In a perfect world, we could ensure perfect bid coverage. Unfortunately, this isn’t possible; bids are often unique and many factors influence a sub’s decision to bid (project location, type of work, availability). Using data, however, we’ve found 2 strategies that GCs can use to increase bid coverage.
- Find the best counties: Identify the best counties for coverage based on the total number of bids and available subs.
- Optimize your ITBs: Identify the characteristics that influence a sub to bid and communicate those upfront in ITBs.
✔️Find the best counties
Combining insights on total bids and subcontractor population, we can infer which counties in TX will statistically have better coverage over many bids. To do that, we’ll calculate a statistic called coverage number.
Coverage number = % of subs in county - % of bids in county
- If the coverage number is high, it means there’s many subs but few bids (i.e. more coverage)
- If the coverage number is low, it means, there’s few subs but many bids (i.e. less coverage)
Based on our data, Rockwall, Ellis, and Kauffman have high coverage scores and rank in the top-10 for population growth in the U.S. These counties have proportionally fewer bids and more subs, likely due to recent population growth and rising construction demand. GCs should focus on high-population counties, but invest in targeting counties with growing populations as they will likely become hotbeds for future construction.
✔️Use ITBs to lean into reasons why subs reject bids
Based on our subcontractor data, we know the factors that influence subs to say yes to GCs.
✅ GC brand: a well-known GC brand, ideally worked with sub previously ✅ Distance: jobs that are within 55 miles to job site , not more than 150 miles ✅ Scope: jobs that are aligned with subcontractors preferred scope
At first glance, these factors seem fixed and unchangeable (i.e. you cannot build your brand if you don’t already have one). What is within a GC’s control, however, is how they communicate via the ITB.
We ran an experiment comparing two types of ITBs:
- Templated ITBs (e.g., BuildingConnected, Planhub, iSqft)
- Optimized ITBs (new ITBs communicating brand and distance to job)
TODO: show image of 2 ITBs side by side
Our data shows that optimized ITBs generate significantly higher response rates and bids from subs.
✔️Visualizations
Optimized ITBs vs Templated ITBs
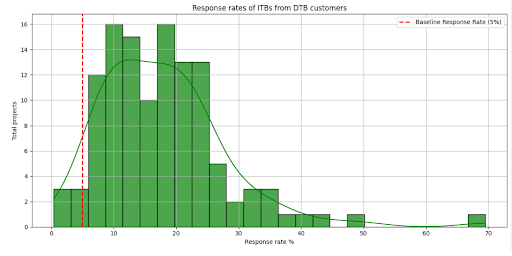 Response rates of DTB customers using optimized ITBs
Counties with best chance of coverage
Top 10
- Rockwall
- Ellis
- Johnson
- Kaufman
- Wise
- Hunt
- Parker
- Waller
- Hill
- Hood
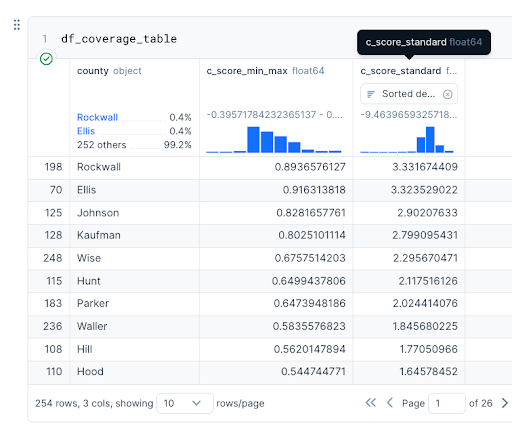 List of counties with highest C-scores
Lowest C-scores (worst coverage)
Bottom 10
- Harris
- Bexar
- El Paso
- Hidalgo
- Dallas
- Cameron
- Travis
- Lubbock
- Tarrant
- Randall
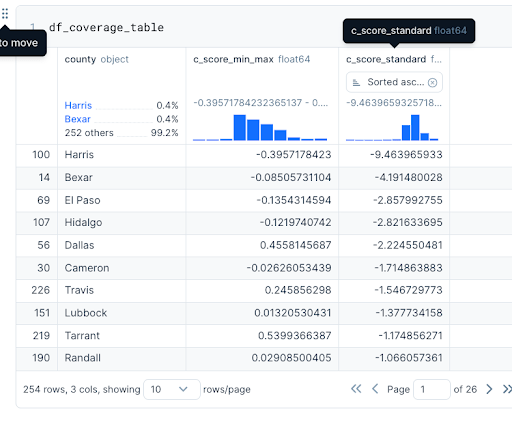 List of counties with lowest C-scores
✔️ 📙Appendix
Bid metrics
- By Population: We calculate the population for each county and determine the percentage of bids for each county based on its population relative to the overall population. This metric assumes that demand is proportional to population size.
- By Actual Bids: We use the total number of bids from our dataset that fall within each county. This provides a direct measurement of demand based on observed bidding activity.
- Composite Metric: This combines the population-based metric and the actual bids metric, weighting each 50/50. This approach balances the potential demand indicated by population size with the observed demand from actual bidding data.
¹ Texas tribune population growth (link) ² We scrape public data sources like GoogleMaps to build a national dataset of subcontractors and then use Downtobid’s AI to classify their trades. ³ Our previous study based on nearly 600k emails, show that most ITBs that subs receive are declined (https://downtobid.com/blog/how-estimating-emails-kill-specialty-subs) ⁴ This statistic doesn’t consider total projects, but rather averages each sub’s mean bidding distance